
Per Capita Nitrous Oxide Emissions

This resource has been reviewed by SubjectToClimate's climate scientists and verified for scientific accuracy and up-to-date information. Learn about our review process →
Provided by: Our World in Data|Published on: July 20, 2021
Data, Graphs, and MapsScientist Reviewed
6-AP
Scientist Reviewed This resource has been reviewed by SubjectToClimate's climate scientists and verified for scientific accuracy and up-to-date information. Learn about our review process →
Synopsis
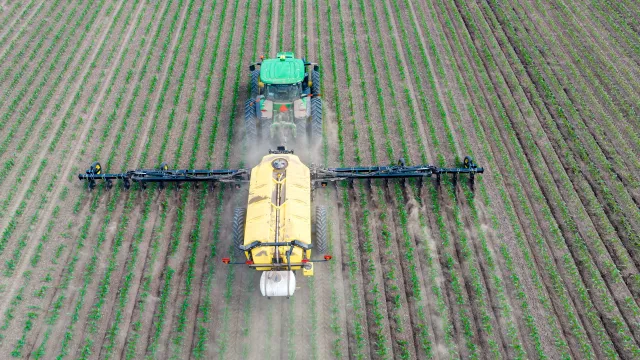
- This interactive map, graph, and table shows the annual per capita nitrous oxide emissions by country, measured in carbon dioxide equivalent emissions, starting in 1965.
- Students can customize the graph, watch a time-lapse animation of emissions on the map, and sort or download the data from the table.
Subjects: Chemistry, Biology, Geography
Authors: Hannah Ritchie, Max Roser
Region: Global
Languages: English
Teaching Materials
Positives
- Students may choose to view datasets for various geographic locations and time periods.
- Related research and data are linked.
- The site explains how the data was collected.
Additional Prerequisites
- Learners need to be familiar with the terms carbon dioxide equivalents and per capita.
- Educators may need time to get familiar with this interactive media before assigning it.
Differentiation
- This can be used in statistics and mathematics classes as a source of data for making graphs or data analysis or as a tool for interpreting graphs and data.
- Science classes can use this information to support lessons about the nitrogen cycle, eutrophication, fertilizer use, greenhouse gas emissions, and solutions to climate change.
- For social studies classes, this could be useful for creating awareness about one or more of the Sustainable Development Goals (SDGs).
This resource explores per capita N2O emissions aggregated from selected countries. Ideally, Global warming potentials for N2O was calculated within a period of 100 years was taken into account to get the sum of CO2 equivalent expressed in tonnes. This resource is recommended for teaching.
Teaching Tips
Standards
Resource Type and Format
Scientist Reviewed
This resource has been reviewed by SubjectToClimate's climate scientists and verified for scientific accuracy and up-to-date information. Our review process ensures that every resource in our library reflects the current state of climate science.
Learn about our review process →