
What Is Drought, and How Is it Measured?
Provided by: Probable Futures|Published on: March 30, 2025|Last updated: July 16, 2026
Grades: 6, 7, 8, 9, 10, 11, 12
Type: Articles/Websites
Subjects: Earth and Space Sciences, Geography
Authors: Probable Futures
Location: Earth
This resource has been reviewed by SubjectToClimate's climate scientists and verified for scientific accuracy and up-to-date information. Learn about our review process →
This resource has been reviewed by SubjectToClimate's climate scientists and verified for scientific accuracy and up-to-date information. Learn about our review process →
Synopsis
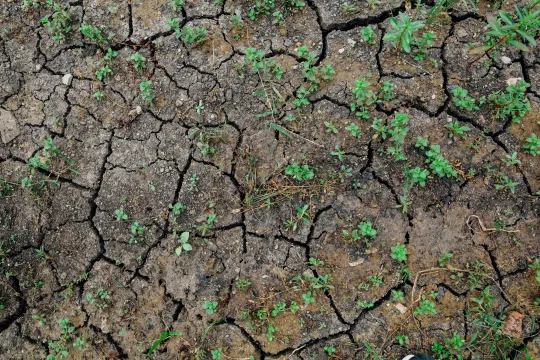
- This article from Probable Futures explains how the type and severity of a drought are measured and how droughts relate to climate change.
- Readers can use the interactive global map to see the difference between 1 degree C of warming vs. 3 degrees C of warming and learn about the potential for desertification in some areas if conditions persist or worsen.
Teaching Materials
Positives
- The interactive map within the article invites students to engage with the data.
- This article provides information concisely and is organized so that readers can easily find what they are looking for.
Prerequisites
- Students should understand climate change and that whether or not humans take action to combat it will determine how much the climate will warm. Students should understand that the different degrees of warming determine how severe related impacts are.
Differentiation & Implementation
- Teachers can expand on the connection between drought and snowpack with the article Disappearing Winter Snowpack.
- Students can use the data map in the article as inspiration for art that can inform and warn others about potential desertification.
- After reading this article, students can take a look at how California communities are trying to solve the problems caused by increasing droughts with the student-facing course Expedition: Water by Design.
- Students can demonstrate their understanding of this article by explaining the different types and levels of drought.
This resource presents a concise introduction to drought and its measurement. The text is clear, with all key terms in bold and thoroughly defined. The role of climate change in exacerbating drought is discussed, and an interactive map that shows long-term drought likelihood under different warming scenarios is included. This resource is recommended for teaching.
Teaching Tips
Standards
Resource Type and Format
Scientist Reviewed
This resource has been reviewed by SubjectToClimate's climate scientists and verified for scientific accuracy and up-to-date information. Our review process ensures that every resource in our library reflects the current state of climate science.
Learn about our review process →