
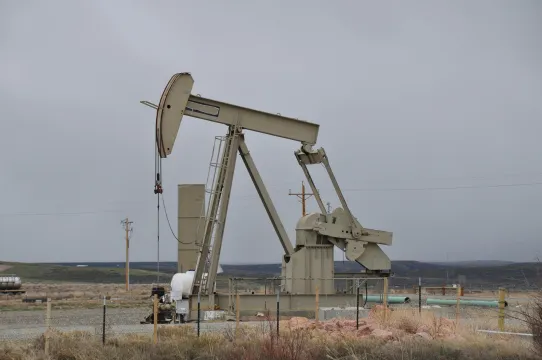
Oil Production

This resource has been reviewed by SubjectToClimate's climate scientists and verified for scientific accuracy and up-to-date information. Learn about our review process →
Provided by: Our World in Data|Published on: July 20, 2021
Data, Graphs, and MapsScientist Reviewed
6789101112
Scientist Reviewed This resource has been reviewed by SubjectToClimate's climate scientists and verified for scientific accuracy and up-to-date information. Learn about our review process →
Synopsis
- This interactive line chart, map, and table from Our World In Data provide students the opportunity to analyze oil production in Terawatt-hours (TWh) for various countries.
- Students can:
- Hover over the line chart of data to get more detailed information.
- Select the countries to include in the chart from a provided list.
- Download the data as a CSV file to do further calculations.
- Download the graph as an image file (PNG) or vector file (SVG).
Subjects: Earth and Space Sciences, Economics, Mathematics
Authors: Our World in Data
Region: Global
Languages: English
Teaching Materials
Positives
- The different visualizations help students with different needs and preferences understand the content.
- Students can easily interact with the user-friendly interface.
Prerequisites
- Students should understand that oil is a fossil fuel and a nonrenewable resource.
Differentiation & Implementation
- Students can discuss how burning fossil fuels like oil contributes to climate change. Students can also talk about how globalization and the exporting of oil have a role in climate change.
- Students can discuss how oil is extracted and what that means for the environment, including impacts on people living near extraction sites.
- Students can also look at oil spills like the Orange County oil spill to discuss the environmental implications. The article Orange County Oil Spill: Drilling is Killing can help facilitate this point.
Oil production is a major activity in the USA. Thus, in the chart, USA data showed a peak in 1965 and also a steady rise from 2010-2015 up until 2019. Students can visualize this to understand the rate of oil production for energy in different countries applicable to this resource.
Teaching Tips
Standards
Resource Type and Format
Scientist Reviewed
This resource has been reviewed by SubjectToClimate's climate scientists and verified for scientific accuracy and up-to-date information. Our review process ensures that every resource in our library reflects the current state of climate science.
Learn about our review process →