
Arctic Sea Ice Minimum Extent

This resource has been reviewed by SubjectToClimate's climate scientists and verified for scientific accuracy and up-to-date information. Learn about our review process →
Provided by: NASA|Published on: April 27, 2021
Data, Graphs, and MapsScientist Reviewed
6789101112
Scientist Reviewed This resource has been reviewed by SubjectToClimate's climate scientists and verified for scientific accuracy and up-to-date information. Learn about our review process →
Synopsis
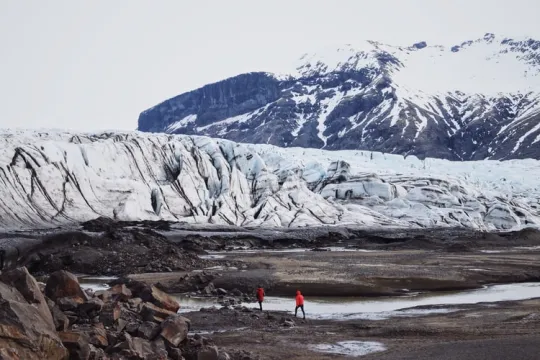
- This page shows a graph of historical data (including the most recent measurements) of the minimum amount of Arctic sea ice each year.
- The page also includes the average rate of change over time and an interactive map visually showing the changes in Arctic sea ice over time.
Subjects: Earth and Space Sciences
Authors: NASA
Region: Polar Regions
Languages: English
Teaching Materials
Positives
- Graphs and text are straightforward and easy to understand.
- The time-lapse video is very powerful.
Additional Prerequisites
- The data is in square kilometers.
Differentiation
- This is a great resource to use as a hook for a lesson or unit on climate change or habitat degradation.
- This resource can also be used as an introduction to and/or an example of positive (self-reinforcing) feedback loops.
- Connections can be made to the loss of habitat for Arctic species and the effects of the change in energy balance as the albedo of the Arctic changes.
The visuals show a decline in Arctic sea ice due to global warming. The resource is valid, datasets used are accurate, and this resource is recommended for teaching.
Teaching Tips
Standards
Resource Type and Format
Scientist Reviewed
This resource has been reviewed by SubjectToClimate's climate scientists and verified for scientific accuracy and up-to-date information. Our review process ensures that every resource in our library reflects the current state of climate science.
Learn about our review process →